
I want to start this series on indicators with one you will not find in any textbook, because it is the one that taught me what a leading indicator actually is. Unless you have traded oil or worked in petrochemicals you have probably never heard of it. It is the utilisation rate of the world’s ethylene crackers, and for several years it was the first number I looked at when I wanted to know where the global economy was going.
What an ethylene cracker is
A cracker is a very large, very hot plant that takes a hydrocarbon feedstock, ethane in the United States and the Gulf, naphtha from crude oil in Europe and Asia, and breaks the molecules apart to make ethylene. Ethylene is the most produced organic chemical in the world and almost nobody outside the industry has heard of it, because nobody buys ethylene. They buy what it becomes: polyethylene for packaging, film and bottles; PVC for pipes, window frames and flooring; synthetic rubber for tyres; antifreeze; polyester; and a long list of other things. If it is plastic, there is a fair chance it started life in a cracker.
That is what makes the utilisation rate interesting. A cracker runs when its customers are ordering, and its customers are the packaging, construction, automotive and consumer goods industries. When those sectors are busy, crackers run hard, well above 90 per cent of capacity. When orders slow, operators cut rates, because you cannot store ethylene in any quantity and there is no point making what nobody wants. So the rate at which crackers are running is a direct, physical reading of industrial demand, taken weeks or months before that demand shows up in the official statistics.
Why it leads
At Oil Analytics we built models to estimate cracker utilisation at plant, regional and global level, from feedstock flows, margins, maintenance schedules and trade data. My contribution was to turn that output into a leading indicator for the broader economic numbers that traders actually watch, and in particular for the purchasing managers’ indices.
The logic is simple once you see it. A PMI is a survey: purchasing managers are asked each month whether orders, output and employment are up or down. A cracker rate is not a survey. It is what the plants actually did. Manufacturers order polyethylene and PVC before they make the goods, and the goods are made before anyone fills in a survey about having made them. So the cracker rate turns before the PMI turns, and in my experience it turned reliably enough to trade.
There are four things I watched within it. Regional rates against each other, because a gap between, say, US and European utilisation tells you about relative competitiveness as well as demand; American crackers ran hard on cheap ethane while European ones, paying for naphtha and expensive energy, shut. Export flows of ethylene derivatives, because strong demand from the big importing economies in Asia meant strong consumer and industrial activity there. Inventory builds, because when polyethylene stocks rise it means consumers have stopped buying the things it goes into. And new capacity announcements, because nobody spends several billion dollars on a cracker unless they expect demand to grow for decades, and when too many of them do it at once the resulting overcapacity is a warning about the growth forecasts they were all working from.
I used it as part of my toolkit as a macro and oil trader, and I found it most useful for directional trades in crude oil futures, where industrial demand is a large part of the picture and the official data arrives late. I came to think of it as a leading indicator of the leading indicators. It is not infallible and it is not a substitute for the rest of the toolkit, but it was consistently early, and in trading early is most of the game.
Where things stand
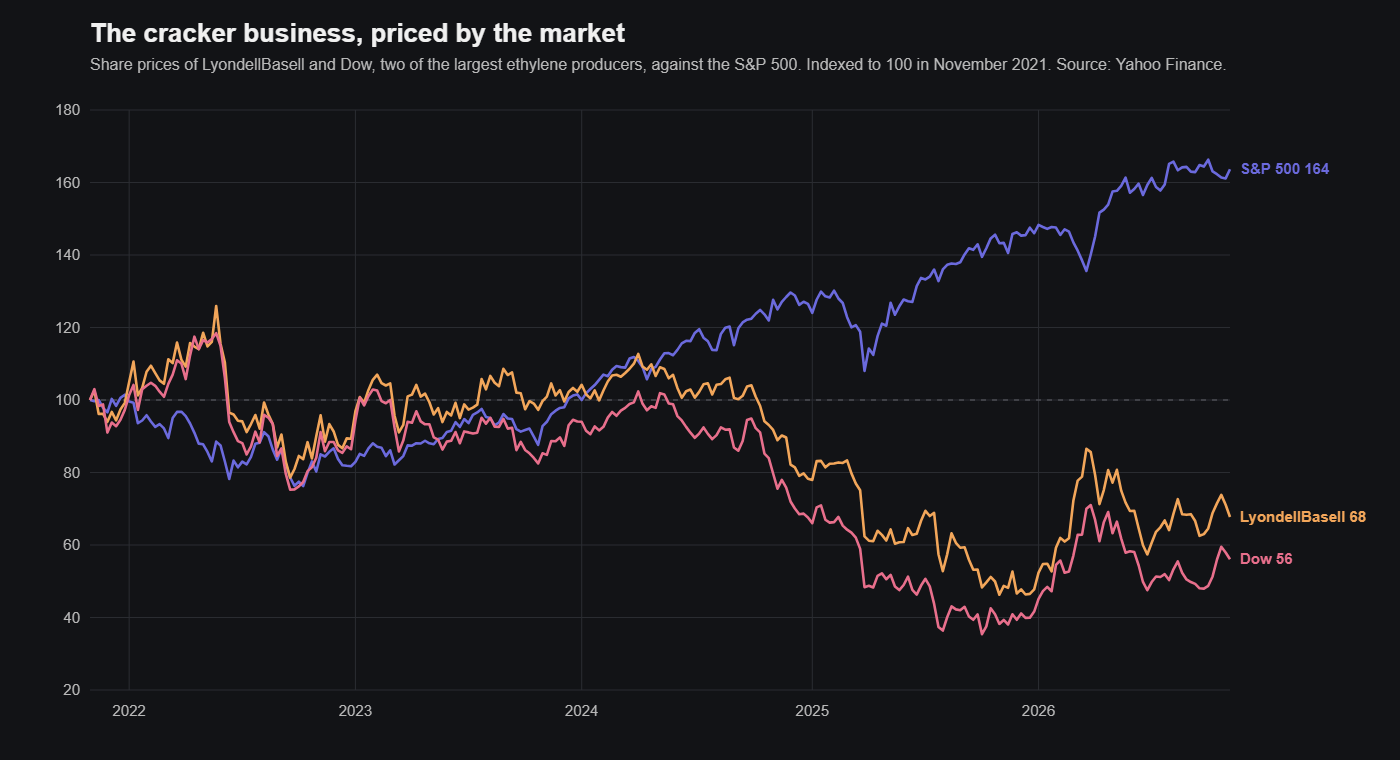
As I write this, in November 2024, industry estimates put global cracker utilisation at around 79 to 82 per cent. That is a long way below the levels above 90 per cent that were normal a few years ago, and the reasons are structural rather than cyclical. A very large amount of new capacity has come on in China, demand growth has been slow almost everywhere, and margins have been poor enough for long enough that operators are closing plants rather than waiting it out. ExxonMobil is shutting its cracker in France, SABIC is closing one in the Netherlands, and the European industry as a whole is being squeezed between high energy costs and ageing plants.
Read as an indicator, that says something uncomfortable. Industrial output is either shrinking or growing too slowly to absorb the capacity that was built for it, and growth is uneven across regions in a way that means strength in one part of the world is not making up for weakness elsewhere. That is consistent with the manufacturing PMIs, which have been sitting around the 50 line that divides expansion from contraction in most major economies, and it suggests the picture does not improve until either demand accelerates or more plants close. Neither has happened yet.
The rest of this series covers indicators you will have heard of: consumer confidence, durable goods orders, non-farm payrolls. I wanted to start with this one because it shows what you are really looking for in any of them, which is a measurement of something physical that has to happen before the thing you care about can happen.