
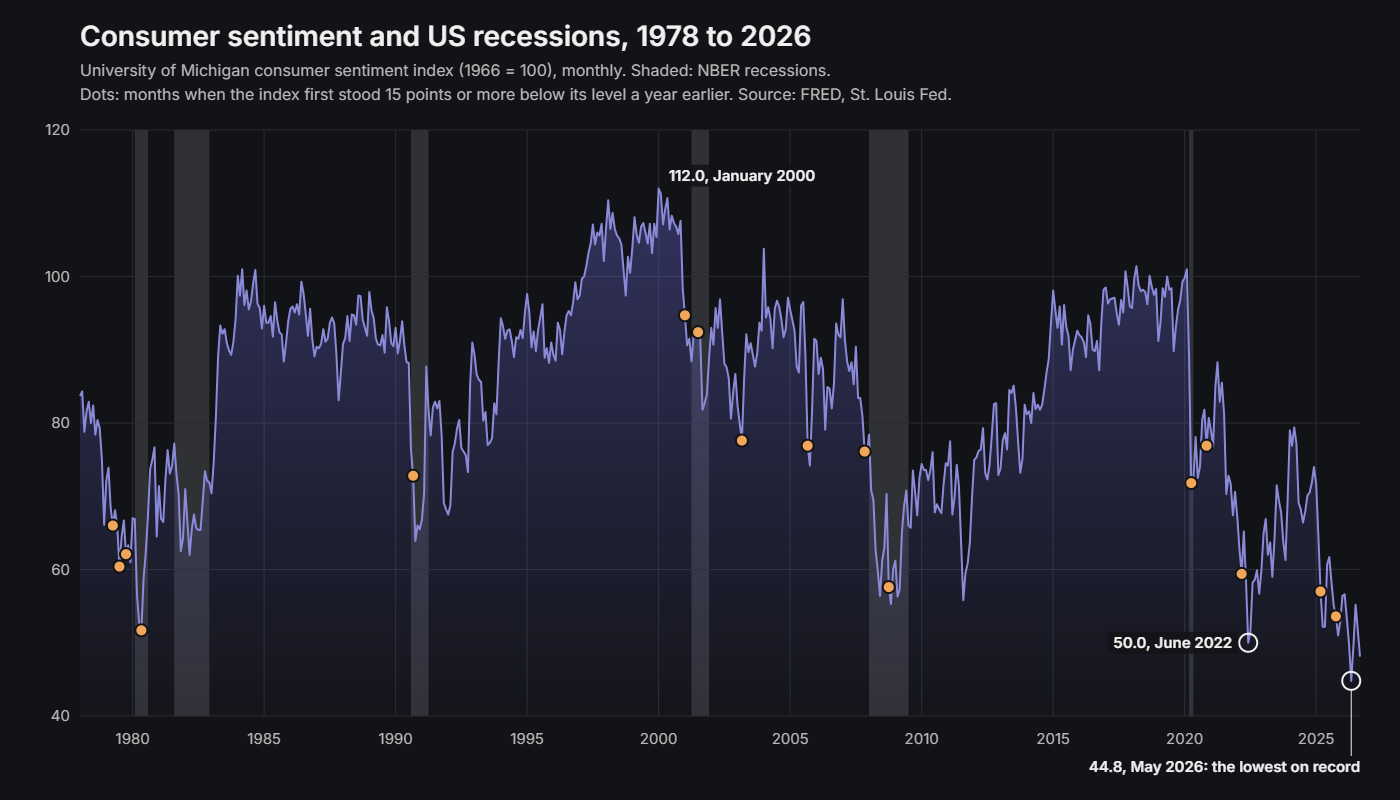
In May 2026 the University of Michigan’s consumer sentiment index fell to 44.8, the lowest reading since the monthly series began in 1978. Over the same months American households carried on spending: in August 2026 real consumer spending was 2.7% higher than a year earlier. Either the survey was wrong, or it was early. Most of this piece is about how to tell the difference.
The first indicator in this series was a physical one, the running rate of ethylene crackers. This one is the opposite kind: a survey. Consumer confidence is nothing more than a few thousand people being asked how they feel about the economy and their own finances, and the reason traders watch it anyway is that in the United States consumer spending is roughly two thirds of GDP, so how those people feel is a fair guide to what the economy is about to do.
What is actually measured
There are two widely followed versions in the US and they are not the same thing. The Conference Board’s Consumer Confidence Index comes out on the last Tuesday of each month. It is built from five questions: how respondents rate current business conditions, how they rate the current job market, and what they expect business conditions, jobs and their own income to look like six months out. The answers are scaled so that 1985 equals 100. The first two questions become the Present Situation Index and the last three the Expectations Index, and the headline is a blend of both.
The University of Michigan’s Consumer Sentiment Index asks a different set of questions, leans more towards personal finances and buying conditions for big-ticket items, and is published twice a month, a preliminary reading around the middle and a final one at the end. Its base is 1966 equals 100. The two indices usually tell the same story but not always, and when they diverge it is often because the Michigan survey is more sensitive to prices and petrol in particular, while the Conference Board survey leans on the labour market.
Other countries have their own equivalents, the GfK survey in the UK and Germany, the European Commission’s consumer confidence indicator for the euro area, and they are read in the same way.
Why it is treated as leading
The argument is that people decide how they feel before they decide how to spend. Someone who is worried about their job puts off the new car and the holiday; someone who feels secure books both. Spending follows sentiment with a lag of a few months, and corporate revenues, employment and eventually GDP follow spending. So a sustained fall in confidence is an early warning of a slowdown, and a sustained rise tends to come before an expansion.
In practice I would put a lot more weight on the Expectations component than on the headline. Present conditions are already known to everyone; they are in the payroll data and the retail sales figures. What people expect in six months is the part that contains any information about the future, and a widening gap between a strong present-situation reading and a weak expectations reading has historically been one of the better signals that a cycle is turning.
What the record says about recessions
The claim that confidence leads the economy can be tested, because the Michigan index goes back to 1978 and the National Bureau of Economic Research dates every US recession. A simple version of the warning is a fall of 15 points or more in twelve months. The dots on the chart mark the first month of each such fall.
There have been six recessions since 1978, and the record against them is mixed:
- 1980: the warning came in April 1979, ten months before the recession began.
- 1981 to 1982: no warning at all. When the second half of that double dip began in August 1981, the index was almost 10 points higher than a year earlier.
- 1990: September 1990, a month after the recession had started.
- 2001: January 2001, three months before.
- 2008: November 2007, two months before.
- 2020: April 2020, a month after. No survey forecasts a pandemic.
So three warnings in advance, two at the start, and one miss. Against that, there were falls of 15 points with no recession behind them in 2003, 2005, late 2020 and 2022. Counting the clusters of dots around 1979 and 1980, 2001 and 2007 to 2008 as one warning each, four of the nine warnings that can now be judged were false alarms. The two in 2025, in March and October, have not been followed by a recession so far, although the NBER dates recessions some time after they begin.
The lead, when there is one, is a few months. That makes a sharp fall in sentiment a confirmation that something is going wrong, rather than a forecast that it will.
Does it predict spending?
The other half of the argument is that mood leads spending. Real consumer spending is published monthly by the Bureau of Economic Analysis, and the series on FRED starts in 2007. Comparing the change in sentiment over a year with the growth in real spending over the following year, from 2008, gives a correlation of about 0.5, as long as you leave out the months from March 2019 to June 2021, whose following year contains the pandemic collapse or the rebound. Include them and the correlation disappears, to about minus 0.1, because in 2020 sentiment and spending collapsed together and spending recovered far faster than mood did.
2022 is the clearest failure. The index fell to 50.0 in June 2022, then the lowest on record, with inflation at its highest in four decades, and real spending still grew by 2.0% over the following twelve months. 2026 so far looks similar. The fall came as Brent crude went from about $72 a barrel to more than $110 in March, which fits the Michigan survey’s sensitivity to petrol prices, and from the May low to August real spending still grew by 1.1%.
The likely reading is that in both years people were telling the surveyor how they felt about prices, not changing what they did with their income. That is exactly the distinction the survey cannot make on its own.
How the different markets use it
In equities, the obvious application is the sectors that live on discretionary spending: retail, cars, travel, restaurants. A turn in confidence tends to show up in those names first. In currencies, a strong reading in a major economy supports its currency, mainly because it raises the odds that the central bank keeps rates higher for longer. In bonds the same logic runs the other way: confident consumers spend, spending pushes on prices, and yields rise on the expectation of tighter policy. And in commodities, oil in particular, the link is through activity. People who feel confident drive, fly and buy things that have to be shipped, all of which uses energy.
It is worth saying that none of these markets react to the level of the index. They react to the difference between the number and what the consensus expected. A reading of 100 can move the market if everyone was looking for 105, and a reading of 95 can pass without comment if that is what was pencilled in. If you are going to trade around the release, the consensus forecast is the number you need, not the history.
Where it misleads
It is a survey, and surveys measure mood. A bad week of headlines can push the index around without anything having changed in people’s actual finances, and the index can lag reality as well as lead it, because people sometimes carry on spending out of habit while telling the surveyor they are worried, and vice versa. It also says nothing about who is confident. An average can hide a split between households that are doing well and households that are not, and the two groups do not spend in the same places.
So I read it alongside things that are not opinions: payrolls, retail sales, inflation, and the PMIs, and I pay attention to the direction over three or four months rather than to any single print. On its own, consumer confidence is a mood ring. Combined with the hard data, it is a reasonable early read on which way the mood is pushing the numbers.
Checking it yourself
All three series are free on FRED. In Python, with pandas, the tests above take a few lines:
import pandas as pd

url = "https://fred.stlouisfed.org/graph/fredgraph.csv?id=UMCSENT,USREC,PCEC96"
df = pd.read_csv(url, index_col=0, parse_dates=True).loc["1978":]

drop = df["UMCSENT"] - df["UMCSENT"].shift(12)
warnings = df[(drop <= -15) & (drop.shift(1) > -15)]
print(warnings[["UMCSENT", "USREC"]])

fwd = df["PCEC96"].shift(-12) / df["PCEC96"] - 1
print(drop.loc["2008":].corr(fwd.loc["2008":]))
The first print lists every warning month; compare it with the recession dates. The second gives the correlation with the pandemic years included. Drop the windows that run through 2020 and you get the stronger figure. In a systematic model, a survey like this is one input among many, scaled and combined with the others, as I described in the piece on what a systematic macro fund does.