
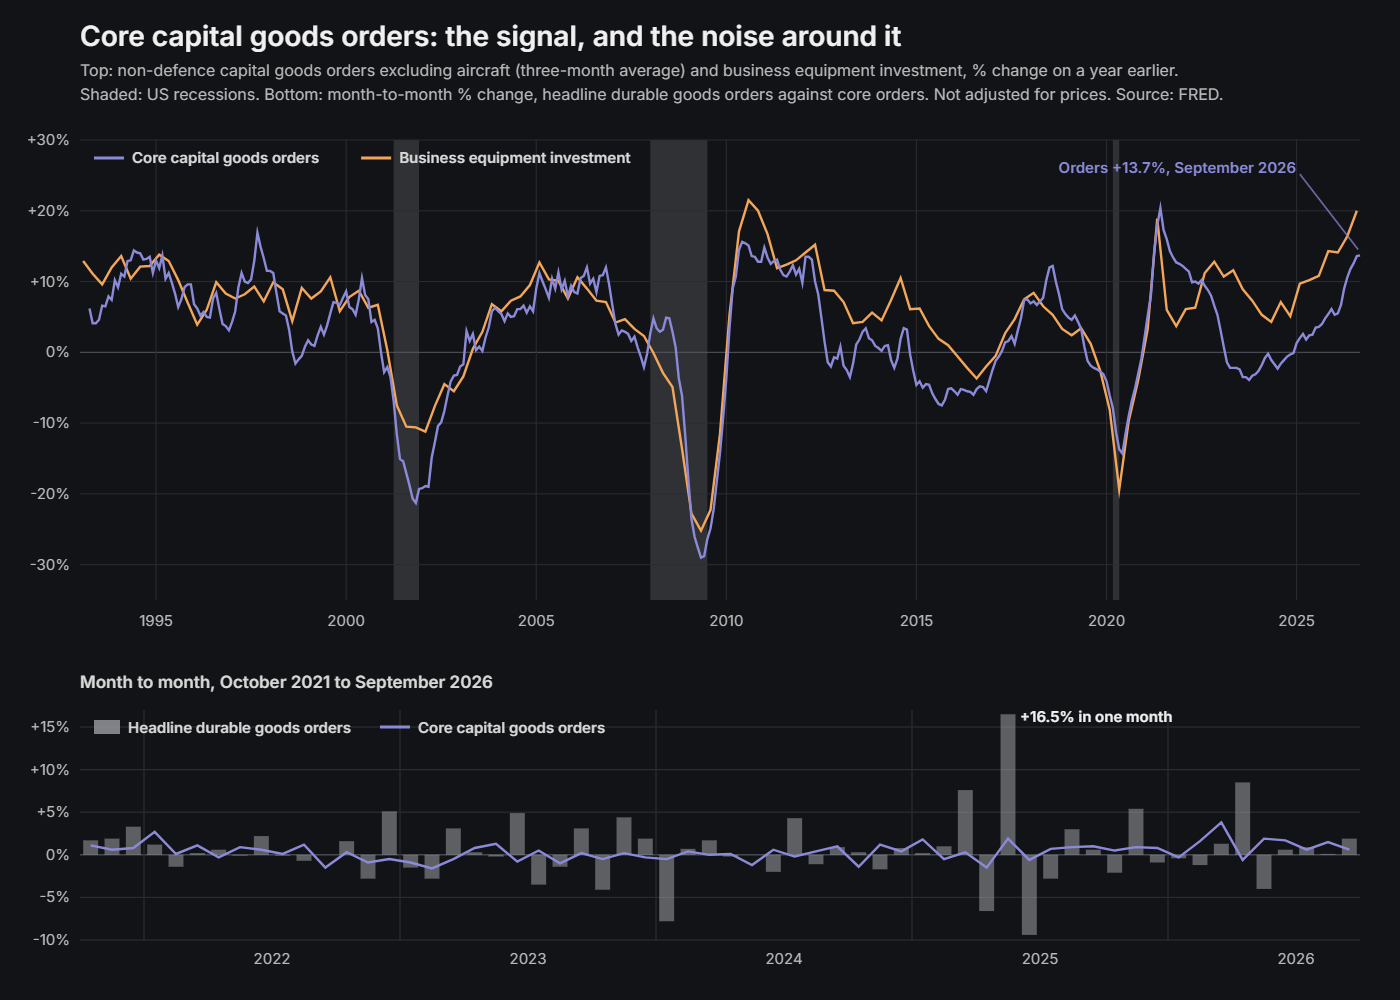
In September 2026 American manufacturers took $88.2 billion of orders for core capital goods, the most in any month since the series began in 1992 and 13.7% more than a year earlier. In the third quarter, business spending on equipment was running about 20% above a year before. If the orders report is a leading indicator, it is pointing firmly up. Whether it really leads is worth checking, because the answer is more useful than the textbook version.
Durable goods orders are the business-investment counterpart to consumer confidence. Where the confidence survey asks households how they feel, the durable goods report counts what companies have actually ordered from American factories, and because a company does not order a new machine tool or a fleet of lorries unless it expects to need them, the number is a reasonable early reading of where business investment, and therefore production, is heading.
What the report is
A durable good is anything built to last three years or more: aircraft, cars and trucks, industrial machinery, computers, appliances, furniture. The US Census Bureau publishes new orders for these each month, with an advance report around the 26th and the full version about a week later. The advance report is the one that moves markets.
The headline number is total new orders, and it is almost useless on its own, because it includes aircraft. A single large order from an airline to Boeing can swing the headline by billions of dollars in a month that otherwise looked ordinary, and the following month it swings back. So the first thing anyone does is look at orders excluding transportation, which strips out aircraft and motor vehicles and gives a steadier picture of everything else.
The number I actually watch is further down the table: non-defence capital goods orders excluding aircraft. That line is what companies are spending on the equipment they use to produce things, with the lumpy and the government-driven items removed, and it is the closest thing the report offers to a clean measure of business investment. It is sometimes called core capex, and it feeds almost directly into the investment line of GDP.
Why it leads
Orders come before production, and production comes before the employment and output figures that most people wait for. A company that has just ordered equipment is going to install it, staff it and run it over the following months, so a sustained rise in orders is a fair signal that industrial output and investment are going to be stronger a quarter or two out. A sustained fall is the reverse, and it usually shows up in the orders data before it shows up in the payrolls.
It is also an unusually direct reading of business confidence, because it is backed by money. Surveys of executives are cheap to answer optimistically. An order for a new production line is not.
What thirty years of data show
The report goes back to 1992 on FRED, which is long enough to test the three things usually said about it.
The first is that the headline is noise. It is. Since 1992 the typical monthly move in total durable goods orders has been 4.4%, against 2.9% for core capital goods orders and 2.0% for orders excluding transportation. The headline has moved by more than 5% in a single month 74 times, and once by 26.4%. In 149 of 415 months, about one in three, the headline and the core line moved in opposite directions. In May 2025 the headline rose 16.5% in one month; core orders rose 1.9%, an ordinary month. Core capex is itself noisier than the ex-transportation line, because it covers a narrower set of goods, which is why most people read it as a three-month average.
The second is that orders lead investment by a quarter or two. That is less true than it sounds. Comparing the yearly change in core orders with the yearly change in business equipment investment, from 1993 and leaving out 2020 and 2021, the correlation is 0.85 in the same quarter, 0.80 one quarter later, 0.65 two quarters later and 0.21 a year later. Orders and investment move almost together. The lead that matters is in the publication calendar: by the time the first estimate of GDP for a quarter comes out, two of that quarter’s three months of orders have been public for weeks. The report is less a forecast of investment than an early look at it.
The third is that orders turn before recessions. There have been three US recessions since the series began. Core orders, on a three-month average, were below their level a year earlier from December 2000, four months before the 2001 recession began. Before the 2008 recession they dipped below for three months from October 2007, and only collapsed once the recession had started. Before 2020 they had been falling since July 2019, eight months before a recession whose cause no economic indicator could have seen.
The false alarms are as instructive. Core orders fell for more than two years from late 2014 to early 2017 with no recession, a period that coincided with the collapse in oil prices and the cuts in energy companies’ spending on equipment that followed. And from 2023 to the end of 2024 they were below their year-earlier level for twenty-two months while equipment investment kept growing, as the chart shows. The report counts orders placed with American manufacturers; equipment bought from abroad appears in investment but never in these orders. When the two diverge for that long, the orders data is telling you about American factories, not about American businesses’ spending.
How it moves markets
As with every release in this series, what moves prices is the gap between the print and the consensus, not the level. A strong core capex number against a weak consensus tends to lift cyclical equities, in particular the industrial and capital goods companies that are on the receiving end of the orders, and to push bond yields up, because strong investment raises the odds that the central bank keeps policy tight. A weak surprise does the opposite. In currencies the same logic applies through the rates channel: a strong report supports the dollar.
The sector breakdown is worth reading as well as the totals. Orders for computers and electronic products, for machinery, and for fabricated metals each tell a different story, and a month where the total is flat can hide a strong move in one of them that matters for a particular group of stocks.
Where to be careful
The headline is erratic for the reason already given, and defence orders add a second source of noise, since they are driven by procurement timetables rather than the business cycle. Use the ex-transportation and core capex lines and treat the headline as a curiosity.
Revisions are large. The advance figure is an early estimate and the full report a week later often changes it materially, sometimes reversing the sign of the monthly move. A trade placed on the advance print is a trade on a number that is about to be revised.
And the lead is not immediate. Orders signal investment that will happen over the coming months, so the report is better at telling you the direction of the next two quarters than what will happen next week.
Two periods illustrate all of this. The tariff uncertainty of 2018 had companies bringing orders forward or holding them back depending on which goods were about to be hit; the headline swung around with aircraft deliveries, the core number was more stable, and the revisions were heavy, and anyone reading only the first line would have come away with the wrong picture of what manufacturers were doing. Then in 2021, as the economy reopened, orders surged as businesses rebuilt inventory and invested to catch up, and the core capex line was one of the earlier signs that the recovery was going to bring inflation with it, which is exactly the kind of reading the Federal Reserve was slow to act on.
As with the consumer confidence index, this is one input, not a verdict. I read it alongside the ISM manufacturing survey, retail sales and the labour market data, and it is the combination that tells you something. The next post in the series covers the one of those that gets the most attention, non-farm payrolls.
Checking it yourself
The series are free on FRED: DGORDER for total durable goods orders, NEWORDER for core capital goods, and Y033RC1Q027SBEA for business equipment investment. In Python, with pandas:
import pandas as pd

base = "https://fred.stlouisfed.org/graph/fredgraph.csv?id="
m = pd.read_csv(base + "DGORDER,NEWORDER", index_col=0, parse_dates=True)
print(m.pct_change().std() * 100)        # typical monthly move, headline and core

core = m["NEWORDER"].rolling(3).mean().pct_change(12)
eq = pd.read_csv(base + "Y033RC1Q027SBEA", index_col=0, parse_dates=True).squeeze().pct_change(4)
q = core.resample("QS").mean().to_frame("orders").join(eq.rename("equipment")).dropna()
for lead in range(5):
    print(lead, round(q["orders"].corr(q["equipment"].shift(-lead)), 2))
Your correlations will differ a little from mine depending on how the months are averaged into quarters and whether 2020 and 2021 are left in, but the shape is the same: highest at no lead, fading fast after two quarters. All the figures here are in dollars, not adjusted for prices, which matters in a year of fast inflation.