
Non-farm payrolls is the data release that every trader on every desk in every time zone has in the diary. It comes out at half past eight in the morning New York time on the first Friday of the month, and for a few minutes afterwards the dollar, Treasuries and equity futures all move at once. If you have ever wondered why a trading floor goes quiet at 1.30 on a Friday afternoon in London, this is why.
What the report is
The Employment Situation report from the US Bureau of Labor Statistics contains two separate surveys. The establishment survey asks businesses how many people were on their payrolls, and that produces the headline number: the change in non-farm payroll employment over the month. The household survey asks people whether they are working or looking for work, and that produces the unemployment rate and the participation rate. The two surveys do not always agree, which is one of the first things to understand about the report.
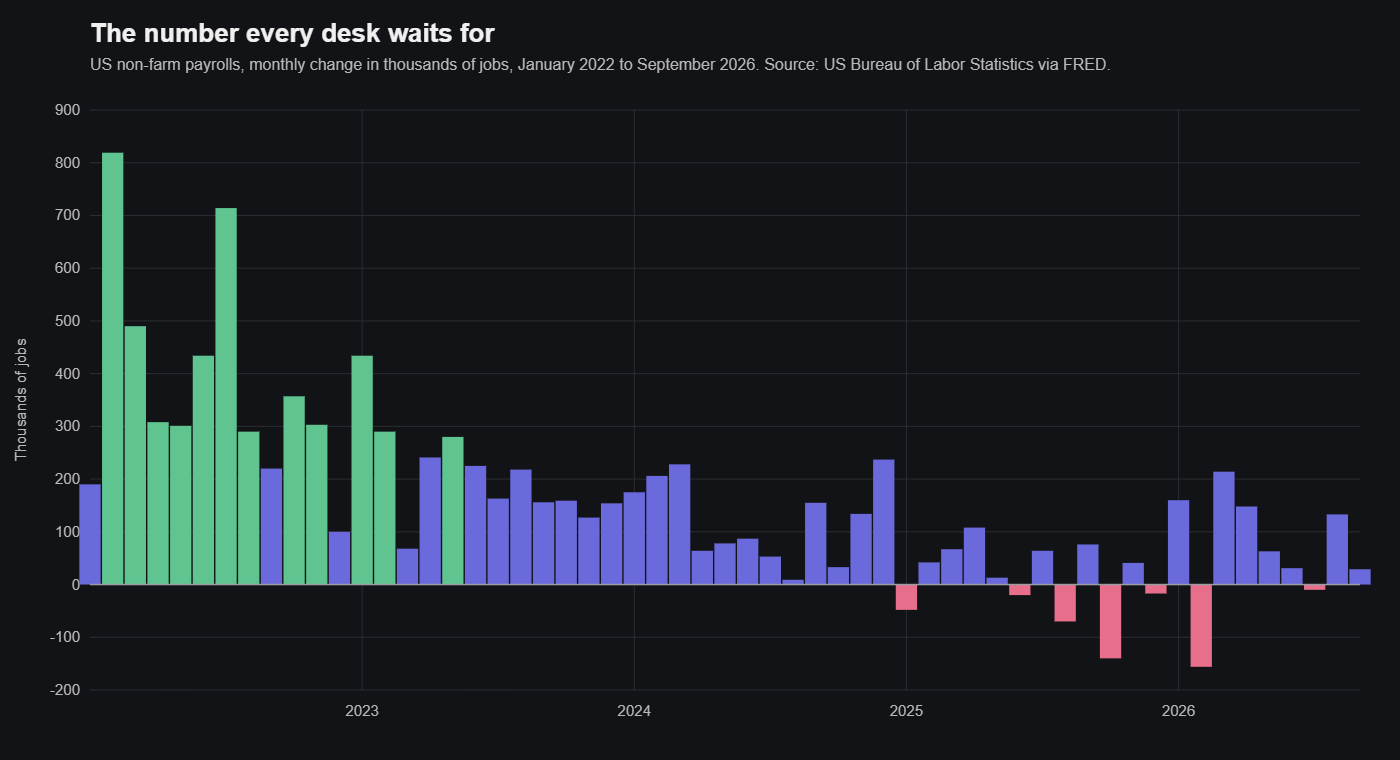
Non-farm means what it says. Farm workers are excluded, as are the self-employed, people employed in private households, unpaid family workers and the military. What remains is roughly four fifths of everyone who contributes to US output, and the monthly change in that figure, typically somewhere between a loss of a hundred thousand and a gain of three hundred thousand in a normal year, is the single most watched statistic in finance.
The report also gives average hourly earnings, which is the main monthly reading on wage growth, average weekly hours, and a breakdown by sector. All of those matter, and the earnings figure in particular has at times moved markets more than the headline.
Is it actually a leading indicator?
Strictly, no, and it is worth being honest about this. Employment is one of the last things to turn in a cycle. Companies hold on to staff until they are sure a downturn is real and are slow to hire until they are sure a recovery is, so payrolls tend to confirm what the orders data and the surveys were saying two or three months earlier. The durable goods and confidence numbers in the earlier posts in this series lead the economy. Payrolls lag it.
What payrolls lead is policy and markets, and that is why traders treat the report as they do. The Federal Reserve has a mandate for employment as well as prices, and the labour market is the thing it looks at hardest when deciding whether to raise, hold or cut. A string of strong payroll numbers makes tightening more likely; a string of weak ones brings cuts forward. Since the whole yield curve, the dollar and the valuation of every equity are priced off the expected path of interest rates, a surprise in payrolls reprices all of them at once.
There are also parts of the report that are genuinely early. Temporary help employment tends to turn before total employment, because temps are the first to be let go and the first to be hired back. Average weekly hours fall before headcount does, because employers cut shifts before they cut staff. And the revisions to the previous two months, which are published alongside the new figure, often say more about the trend than the new figure itself.
What moves on the day
The reaction is to the surprise, not the level. The market has a consensus forecast going into the release, and what matters is whether the print lands above or below it and by how much. A gain of 150,000 can be a strong number if the forecast was 50,000 and a weak one if the forecast was 250,000.
In currencies, a stronger-than-expected print usually lifts the dollar, because it raises the expected path of rates, and the major pairs against the dollar see some of their largest moves of the month in the minutes after the release. In bonds, yields rise on a strong number and fall on a weak one, and the two-year, which is the most sensitive to the Fed, moves most. Equities are less predictable. Strong jobs are good for earnings but bad for the rate outlook, and which of those wins depends on what the market was worried about going in. In a period when inflation is the concern, a strong report can send stocks down.
The earnings number cuts across all of this. A headline that comes in on consensus but with hourly earnings well above it will be read as inflationary, and the market will trade it that way.
How I approach it
I look at the indicators that come out in the days before, which are the ADP private payrolls estimate, the weekly initial jobless claims, and the employment components of the ISM surveys. None of them predicts the headline reliably, and ADP in particular has a poor record, but together they tell you whether the risk is skewed to a strong or a weak surprise.
I do not try to trade the release itself. The first few minutes are a coin toss with wide spreads, and the initial move reverses often enough that being right about the number is no guarantee of being right about the trade. What I do is make sure the book is sized for the volatility, with stops wide enough to survive the spike, and then read the full report, including the revisions, the hours and the earnings, before deciding whether anything has actually changed. Most months nothing has. The months when something has are the ones that matter, and they are easier to recognise if you were not already in a position by 8.31.