
This follows on from the post where I worked through the Pearson correlation between Bitcoin and Ethereum in Python. That one was about getting the number. This one is about what to do with it, because a correlation coefficient on its own is not much use to anyone, and the question people actually ask is simpler than the statistics: if I hold both of these, am I diversified or not?
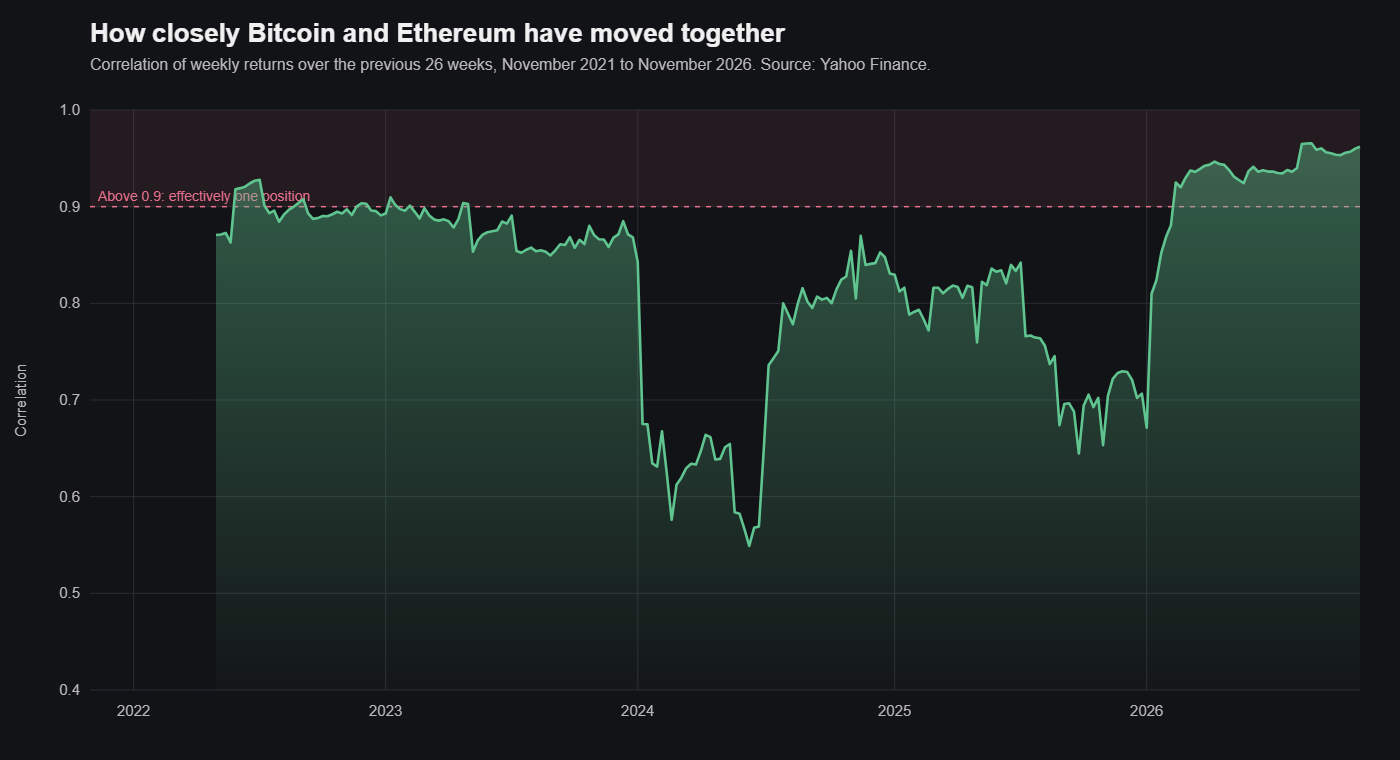
The short answer is less than you think, and it depends when you ask.
What the number is telling you
Correlation measures how two assets move relative to each other on a scale from -1 to 1. At +1 they move together in lockstep, at 0 their moves have nothing to do with each other, and at -1 one goes up when the other goes down. Diversification only reduces risk when the things you hold sit well below 1, because the whole idea is that when one position is losing, another one isn’t.
Bitcoin and Ethereum are the two largest coins, they trade on the same venues, to the same people, driven by the same headlines. It would be surprising if their daily returns were not closely related, and in practice they usually are. The correlation is not fixed, though. It drifts between periods where the two go their own way and periods where they are effectively one position, and the swings between those two states are what matter for a portfolio.
Where it bites
The clearest illustration is the 2022 bear market. Bitcoin and Ethereum moved almost identically on the way down and both ended up more than 70 per cent below their all-time highs. If you held both thinking you had spread your risk, you hadn’t. You had one bet with two tickers on it.
This is the awkward property of correlation in crypto, and in most risk assets really: it rises when markets fall. The moment you most want your holdings to behave differently is the moment they are most likely to behave the same. So any diversification you measured during a calm period is an overestimate of what you will get when you need it.
The other side of it
High correlation is not purely a cost. In a rising market both assets go up together, which is why a two-coin portfolio can look so good in a bull run. The price is volatility: the swings in the two positions stack on top of each other rather than cancelling out. Whether that is acceptable is a personal question about how large a drawdown you can sit through without doing something rash, and I would suggest answering it honestly before the drawdown rather than during it.
What I would actually do about it
Keep an eye on the rolling correlation rather than a single number, because it changes. When it climbs towards 0.9 and above, treat the two holdings as one and size them accordingly, or trim one of them. If you want real diversification it has to come from something outside crypto: equities, gold, bonds, or simply cash. Cash is underrated here, since a reserve lets you buy after the kind of synchronised fall described above instead of being forced to sell into it. And if you understand the instruments, futures and options can hedge a period where you expect both to fall together, though that is a separate topic and not something to do casually.
Plotting the rolling correlation in Python
The code below pulls daily prices from Yahoo Finance, works out daily returns, and plots the correlation over a rolling 30-day window. Thirty days is short enough to show the regime changes and long enough not to be pure noise. Sixty or ninety days gives a smoother line if you prefer.
import yfinance as yf
import pandas as pd
import matplotlib.pyplot as plt

# daily closes for both coins
btc = yf.download("BTC-USD", start="2022-01-01", end="2025-01-01")["Close"]
eth = yf.download("ETH-USD", start="2022-01-01", end="2025-01-01")["Close"]

df = pd.concat([btc, eth], axis=1)
df.columns = ["BTC", "ETH"]

# daily returns, then the correlation over a rolling 30-day window
returns = df.pct_change().dropna()
rolling_corr = returns["BTC"].rolling(window=30).corr(returns["ETH"])

plt.figure(figsize=(12, 6))
plt.plot(rolling_corr, label="BTC-ETH 30-day rolling correlation")
plt.axhline(y=0, color="grey", linestyle="--", linewidth=1)
plt.axhline(y=1, color="red", linestyle="--", linewidth=1, label="perfect correlation")
plt.title("Bitcoin and Ethereum: 30-day rolling correlation of daily returns")
plt.xlabel("Date")
plt.ylabel("Correlation")
plt.legend()
plt.grid(True)
plt.show()
Run it and you will probably see the line spend most of its time somewhere between 0.6 and 0.9, with dips when one coin has a story of its own for a few weeks, and spikes towards 1 during sell-offs. That picture is worth more than any single coefficient, and it is the thing I would look at before deciding how much of each to hold.