
In the week of 24 August 2026 the US 3-2-1 crack spread reached $75.30 a barrel, the highest weekly figure in five years of futures prices. In the second week of September 2024 it had been $14.60. Same refineries, same crude, same products. The difference between those two numbers is most of what you need to know about how refiners make money, and why a number most people have never heard of matters to anyone who trades oil.
I spent a large part of my career modelling refineries. At Oil Analytics we built a framework that followed crude through the refinery and the petrochemical plants behind it, and every model of a refinery starts from the crack spread. This is the explanation I would give someone starting on an energy desk.
What the crack spread measures
A refinery buys crude oil and sells what it makes from it. “Cracking” is the refining step that breaks heavy hydrocarbons into lighter ones, and the crack spread is the difference between the value of the products and the cost of the crude. It is the closest thing the market has to a published refining margin.
There are several versions. The one quoted most in the US is the 3-2-1: three barrels of crude in, two barrels of gasoline and one barrel of distillate (diesel or heating oil) out. The US Energy Information Administration uses it because that ratio approximates the product yield at a typical US refinery. There is also a simple 1:1 spread between one product and crude, and a 5-3-2 version for refineries that make proportionally more distillate.
Working it out
The only awkward part is units. Crude is quoted in dollars per barrel, gasoline and diesel futures in dollars per gallon, and there are 42 gallons in a barrel. So:
\[\text{3-2-1 crack} = \frac{2 \times 42 \times P_{\text{gasoline}} + 42 \times P_{\text{diesel}} – 3 \times P_{\text{crude}}}{3}\]Take the closing prices for the first week of November 2026. RBOB gasoline futures settled at $2.7227 a gallon, ULSD (the New York Harbor diesel contract, still traded under the old heating oil code HO) at $4.1983 a gallon, and WTI crude at $87.96 a barrel. Two barrels of gasoline are worth 2 × 42 × 2.7227 = $228.71. One barrel of diesel is worth 42 × 4.1983 = $176.33. Three barrels of crude cost 3 × 87.96 = $263.88. The difference is $141.16 for three barrels, or $47.05 a barrel.
That is a healthy number. Over the five years from November 2021 the weekly 3-2-1 averaged $32.80.
What it leaves out
The crack spread is a gross figure, and the EIA is careful to say so: it does not include operating costs, other variable costs or any fixed costs. A refinery pays for energy, catalysts, labour, maintenance and the capital it is built on, and none of that is in the number. Two other gaps matter in practice.
The first is the crude. The 3-2-1 uses WTI, a light, sweet crude. Many refineries run heavier, cheaper crudes, and a complex refinery that can process them earns more than the spread suggests. The relationship between crude grades has its own market, which I wrote about in the piece on relative value trading, using the spread between Brent and WTI.
The second is location. The futures contracts are priced in New York Harbor and Cushing, Oklahoma. A refinery on the Gulf Coast or in the Midwest sells into a different local market, and its real margin can sit well above or below the futures crack for months at a time. The spread is the industry’s common yardstick, not anyone’s actual profit and loss.
Two margins inside one number
The 3-2-1 blends two quite different businesses. Split it into a gasoline crack (one barrel of gasoline against one of crude) and a diesel crack (one barrel of diesel against one of crude) and they rarely move together. Over the five years to November 2026 the gasoline crack averaged $27.20 a barrel and the diesel crack $44.10. The gasoline crack fell as low as $7.50 in October 2023. The diesel crack reached $112.10 in September 2026.
Diesel has been the more valuable product throughout this period. It is the fuel of trucks, ships, farm machinery and industry, and its demand follows the economy closely. When distillate demand weakens, the blended spread falls with it. The low point in the data, September 2024, is a good example. The Oil & Gas Journal reported, citing the EIA, that refinery margins that month were the lowest for a September in four years, with weak distillate demand, slower activity in China and Europe and new refining capacity in Kuwait, Oman and Nigeria all weighing on them.
The calendar matters more than people expect
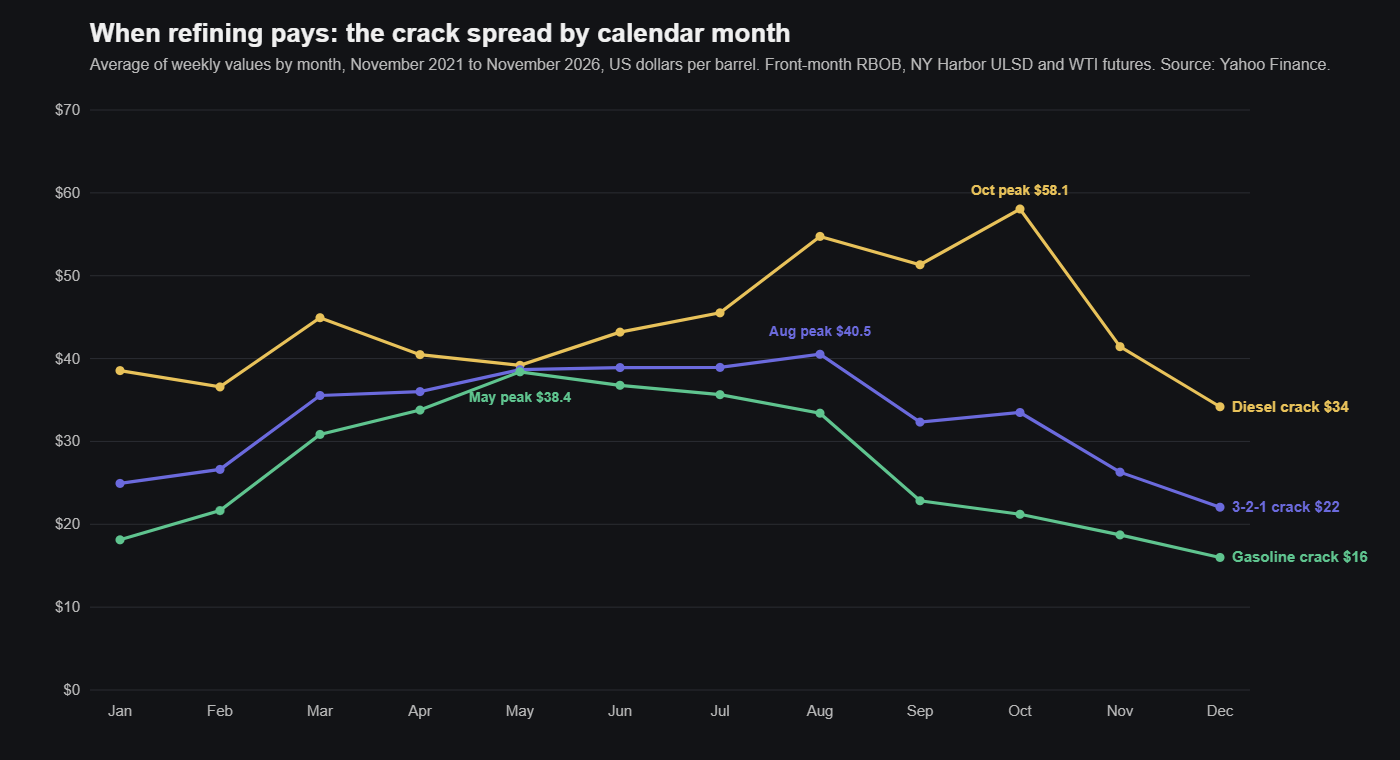
Average the weekly figures by calendar month and the two cracks follow different calendars.
The gasoline crack builds through the spring and peaks in May, at an average of $38.40 a barrel in this data, against $16.00 in December. That is the US driving season: refiners switch to summer-grade gasoline, which costs more to make, and demand rises into the summer holidays. The diesel crack peaks later, in October, at an average of $58.10, against $34.20 in December. Autumn is when distillate stocks are built for the heating season, when harvest machinery runs hardest, and when many refineries take units down for maintenance, which tightens supply just as demand rises.
The combined 3-2-1 is highest in August, averaging $40.50, and lowest in December at $22.10. Five years is a short sample, and 2026 was an unusually strong year that pulls the late-summer averages up, so I would treat the shape as more reliable than the exact numbers.
How the spread is traded
A refiner is naturally long the crack spread: it profits when products rise relative to crude. CME Group’s introduction to crack spreads walks through the standard hedge. A refiner that wants to lock in today’s margin sells product futures and buys crude futures. If the margin then narrows, the loss on the physical business is offset by the gain on the futures. In CME’s example, a crack of $17.20 a barrel locked in January is still worth about $17.20 in March, even though the cash margin has fallen to $13.50. A refinery going into a shutdown does the opposite, because it may have to buy products it would normally make.
For a trader without a refinery, the crack is information. A wide crack tells you refiners are being paid to run hard, which supports crude demand a few weeks later. A crack that collapses tells you product markets are oversupplied before the crude price has caught up. On an energy desk it sits next to the crude price on the screen for that reason. The petrochemical chain behind the refinery has its own margins, and I wrote about one of them in the piece on ethylene crackers.
Calculating it yourself
All three futures prices are free to download. In Python, with the yfinance library, the whole calculation is a few lines:
import yfinance as yf

px = yf.download(["CL=F", "RB=F", "HO=F"], start="2021-11-01", interval="1wk")["Close"]
crack = (2 * px["RB=F"] * 42 + px["HO=F"] * 42 - 3 * px["CL=F"]) / 3

print(crack.describe())
print(crack.groupby(crack.index.month).mean().round(1))
The first print gives you the average, range and spread of the weekly series. The second gives you the average by calendar month, which is how the seasonal figures above were produced. Front-month futures roll from one contract to the next each month, which adds small jumps to a continuous series, so treat any single week with some caution.