
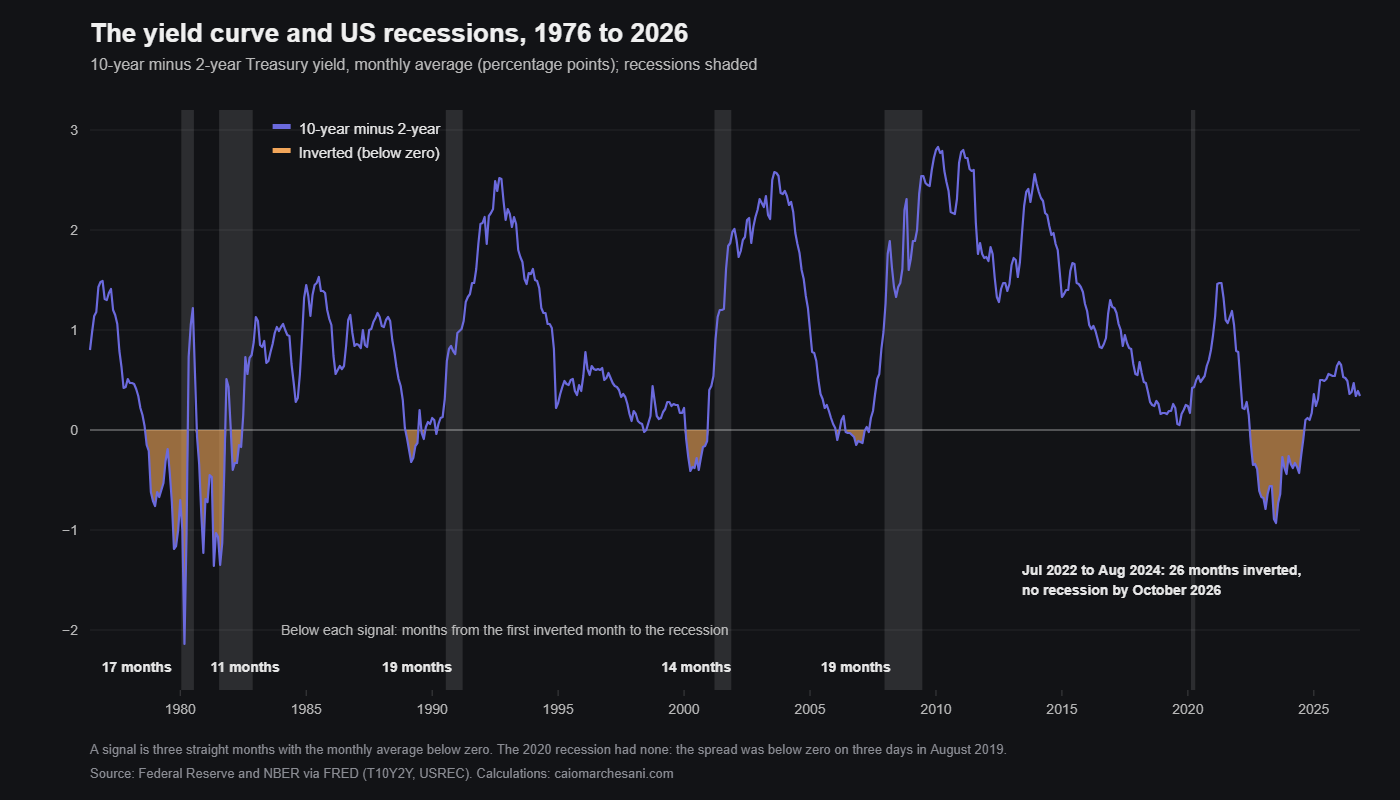
In July 2022 the yield on two-year US Treasuries rose above the yield on ten-year ones and stayed there for 26 months. Every time that had happened for more than a few weeks in the previous half century, a recession had followed within two years. This time, more than four years later, none has been declared.
The inverted yield curve is the best-known recession signal there is. So I went back through fifty years of the data to see what it has called, what it has missed, and what that says about how to use it.
What an inverted curve is saying
Normally a lender wants more for ten years than for two, so the ten-year yield sits above the two-year and the difference, the spread, is positive. The two-year yield follows where the market thinks the Federal Reserve’s rate will be over the next couple of years. The ten-year yield follows the longer view.
When the two-year rises above the ten-year, the market is saying that rates are high now and will be lower later. The usual reason for rates to be lower later is that the economy has weakened enough for the Fed to cut. That is the whole logic of the signal. There is a second channel too: banks borrow short and lend long, so an inverted curve squeezes the margin on new lending, and credit gets tighter.
Five signals, five recessions
To keep one-month dips out, I count a signal only when the monthly average of the spread has been below zero for three months running. On that rule the ten-year minus two-year spread gave five signals between 1976 and 2019, and a recession followed every one.
| Inverted from | Months | Deepest | Recession began | Lead | Last inverted |
|---|---|---|---|---|---|
| Sep 1978 | 20 | −2.14 | Feb 1980 | 17 months | Jan 1980 |
| Sep 1980 | 14 | −1.36 | Aug 1981 | 11 months | Jul 1981 |
| Jan 1989 | 6 | −0.32 | Aug 1990 | 19 months | Mar 1990 |
| Feb 2000 | 11 | −0.41 | Apr 2001 | 14 months | Dec 2000 |
| Jun 2006 | 10 | −0.15 | Jan 2008 | 19 months | May 2007 |
| Jul 2022 | 26 | −0.93 | None by Oct 2026 | 51 months so far | Aug 2024 |
Monthly averages of the daily spread, in percentage points, from the Federal Reserve through FRED. “Months” is the length of the first unbroken run below zero. Recession dates are the first full month of each recession as dated by the NBER.
The lead time ran from 11 to 19 months and averaged 16. That is the first thing to understand about this indicator. Even when it worked perfectly, it told you that a recession was coming at some point in the next year or two, which is a statement about the cycle and useless for timing a trade.
The second thing is in the last column. In 1990, 2001 and 2008 the curve had already turned positive again before the recession began, by five, four and eight months. The curve stops being inverted when short yields fall, and short yields fall when the market starts pricing rate cuts in earnest. So the end of an inversion has never been an all-clear. In three of the five cases the recession began within eight months of it.
The recession it did not call
The 2020 recession had no signal on this rule. The spread closed below zero on three days in August 2019, and the lowest it reached was −0.04. The curve built from three-month bills did invert, for five months from May 2019.
I would not score that one either way. The recession that arrived in 2020 was caused by a pandemic, and no bond market forecasts those. Whether the slowdown the curve was hinting at in 2019 would have become a recession on its own is something nobody can know.
The signal with no recession
The 2022 inversion is the hard case. The spread first closed below zero on 1 April 2022 and gave a signal on my rule from July. It then stayed inverted for 26 months, the longest run in the series, against 20 months in 1978 to 1980. It closed below zero on 541 trading days. On 3 July 2023 it reached −1.08, the most inverted it had been since 1981.
The economy slowed, but it did not break. Unemployment was 3.5 per cent in July 2022, touched 3.4 per cent in April 2023, rose to 4.5 per cent by November 2025 and was back at 4.1 per cent in October 2026. The NBER has declared no recession. It dates them with a long delay, a full year in the case of the 2008 recession, so “none by October 2026” means none declared. But 51 months have passed since the signal, and the longest lead in the table is 19.
How confident the model was
Counting inversions treats every one alike. The more careful way to use the curve, and the one the New York Fed has published for years, turns the spread into a probability. I fitted the same kind of model, a probit, on 708 months from 1960 to 2018, using the ten-year yield minus the three-month bill, and asked what the spread in each month said about a recession twelve months later:
\[P(\text{recession within 12 months}) = \Phi(\alpha + \beta\,S_t)\]Φ is the cumulative normal distribution and S is the spread in percentage points. The fit gives α = −0.45 and β = −0.73. A flat curve means a 32 per cent chance of a recession a year later. A curve inverted by one point means 61 per cent.
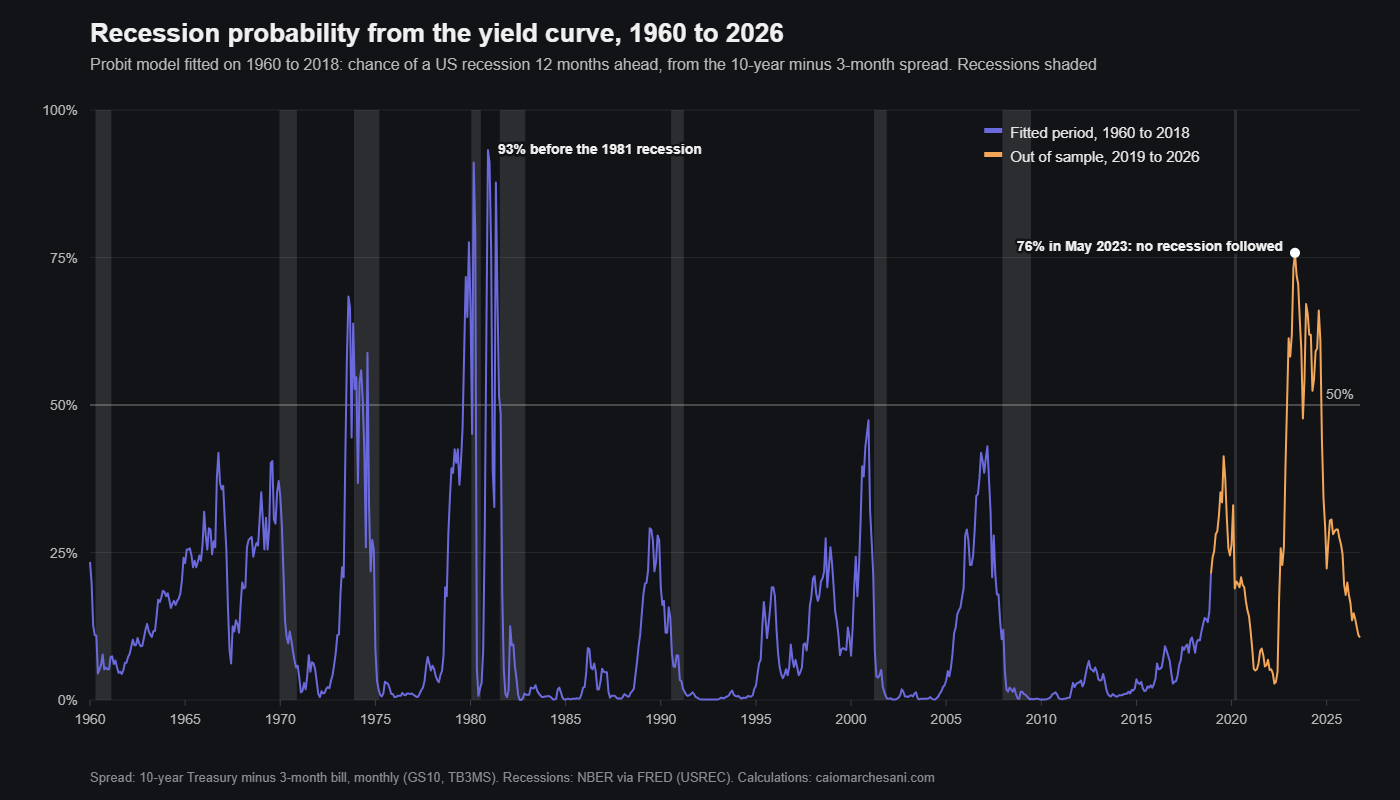
The useful comparison is the highest probability the model reached in the two years before each recession. It was 40 per cent before 1970, 68 per cent before 1973, 78 per cent and 93 per cent before the two recessions of 1980 and 1981, then 29 per cent before 1990, 47 per cent before 2001, 43 per cent before 2008 and 41 per cent before 2020. In the last four recessions the curve never said better than even odds.
In May 2023 it said 76 per cent. It stayed above 50 per cent for 21 months, from December 2022 to September 2024. That was the most confident call the model had made since 1981, and none of those months was in the period it was fitted on. It was a true out-of-sample forecast, and it was wrong.
Why I think it failed this time
The first thing to rule out is a distorted curve. The ten-year yield is the market’s expected path of short rates plus a term premium, the extra return investors demand for lending long. If the premium had been crushed, for example by years of central-bank bond buying, the curve could have inverted without anyone expecting cuts. The Federal Reserve’s Kim and Wright model splits the ten-year yield into those two parts, and the deepest month of each inversion since 1990 looks like this:
| Deepest month | 10-year minus 2-year | Term premium | Expected path |
|---|---|---|---|
| Apr 2000 | −0.41 | +1.26 | −1.67 |
| Nov 2006 | −0.15 | +0.54 | −0.69 |
| Jul 2023 | −0.93 | +0.11 | −1.04 |
Monthly averages, percentage points. Expected path is the ten-year yield minus its term premium, minus the two-year yield. Term premium from the Kim and Wright model (FRED series THREEFYTP10).
The premium in July 2023 was small but positive, and the inversion was almost entirely expectations: the market priced the two-year yield about a point above where it expected rates to average over the next ten years. That is the same message as in 2000 and 2006. The curve was not broken. It was forecasting cuts, and the cuts came.
An inverted curve forecasts lower short rates. It has been a recession signal because, in the past, the only thing that brought rates down quickly was a recession. This time there was another route. Inflation fell from 9.1 per cent in June 2022 to 2.6 per cent in October 2024 without a collapse in demand, and the Fed was able to cut in late 2024 and again in late 2025 because prices had slowed, while the economy kept growing. So the curve’s forecast of lower rates came true, and the recession that usually comes with it did not.
The second reason is how slowly the higher rates reached anyone. The federal funds rate went from 0.08 per cent in February 2022 to 5.33 per cent by August 2023, the fastest rise since the early 1980s. A curve signal works through the cost of credit, and this time most of the credit had been fixed in advance. American households had refinanced into 30-year fixed-rate mortgages at the 2020 and 2021 lows, so the rate rise reached new borrowers, not the stock of debt.
The Federal Reserve’s household debt service ratio, payments on mortgages and consumer debt as a share of disposable income, shows it. It was 15.8 per cent at the end of 2007. It fell to 9.1 per cent in the first quarter of 2021, and after the fastest tightening in forty years its highest reading since 2022 has been 11.3 per cent, at the end of 2025. That is still below the 11.7 per cent of the end of 2019, before any of this started. The squeeze the curve was pricing never arrived in household budgets.
The third reason is fiscal. The federal deficit was 6.2 per cent of GDP in 2024 and 5.8 per cent in 2025, with unemployment close to 4 per cent. Tight money was pushing one way and loose budgets the other, which is the argument I made in the piece on how the pandemic changed the channel. A signal calibrated on decades in which monetary policy did most of the work was always going to struggle in one where it did not.
The squeeze on banks was real. Silicon Valley Bank failed on 10 March 2023, two days after the spread had closed at −1.07, and Signature Bank and First Republic followed within two months. The failures were contained, and the tightening of credit that the curve implied did not turn into a recession.
What I do with it now
I still watch the curve. I have stopped treating it as a verdict.
An inversion tells me the market expects the Fed to cut. Whether the cuts come because of a recession or because inflation has fallen is a separate question, and the curve cannot answer it. For that I want indicators that sit closer to real activity: how hard the ethylene crackers are running, consumer confidence, and what the jobs report is saying underneath the headline. When the curve and those agree, I take it seriously. When payrolls keep growing month after month, as they did all through 2023, the curve on its own is not enough.
The three-month version is worth keeping beside it, because the two can disagree. The ten-year minus three-month spread stayed inverted for 25 months from November 2022, and it dipped below zero again for three months from June 2025, by a few hundredths of a point. On my own rule that counts as a fresh signal on that measure. It is a marginal one, but it meets the rule, so it goes on the record.
The ten-year minus two-year spread was +0.35 on 6 November 2026. The Fed raised rates by a quarter point in September 2026, which I covered in the piece on Fed decision days, and when the Fed is tightening the two-year yield usually rises faster than the ten-year. If the curve inverts again I will note the date and start counting, knowing that the last count has run past four years.
Checking it yourself
The curve, recession, probability, term premium, debt service and unemployment figures above come from the script below. It needs pandas and numpy and reads each series straight from FRED, so no API key is required. The probit is fitted by hand, so nothing beyond those two libraries is needed. The inflation and deficit figures are from the pandemic piece, which has its own script.
from math import erf

import numpy as np
import pandas as pd

FRED = "https://fred.stlouisfed.org/graph/fredgraph.csv?id="


def fred(series):
    return pd.read_csv(FRED + series, index_col=0, parse_dates=True,
                       na_values=".").squeeze().dropna()


def runs(negative, least=3):
    """First month, last month and length of each run of inverted months."""
    block = (negative != negative.shift()).cumsum()
    found = [(g.index[0], g.index[-1], len(g))
             for _, g in negative[negative].groupby(block)]
    return [run for run in found if run[2] >= least]


def months(a, b):
    return (b.year - a.year) * 12 + b.month - a.month


daily = fred("T10Y2Y").loc[:"2026-11-06"]     # 10-year minus 2-year yield
spread = daily.resample("MS").mean()
rec = fred("USREC").loc[spread.index[0]:]     # 1 in an NBER recession month
starts = rec.index[(rec == 1) & (rec.shift() == 0)]

print("Signal    months  deepest  recession  lead  last inverted")
matched = set()
for first, last, n in runs(spread < 0):
    if rec.get(first, 0) == 1:
        continue                              # began inside a recession
    low = spread[first:last].min()
    later = starts[starts > first]
    if len(later):
        s = later[0]
        matched.add(s)
        before = spread[first:s - pd.DateOffset(months=1)]
        final = before[before < 0].index[-1]
        print(f"{first:%b %Y}  {n:6}  {low:7.2f}  {s:%b %Y}   {months(first, s):4}"
              f"  {final:%b %Y}")
    else:
        print(f"{first:%b %Y}  {n:6}  {low:7.2f}  none by {rec.index[-1]:%b %Y},"
              f" {months(first, rec.index[-1])} months on")
print("Recessions with no signal first:",
      ", ".join(f"{s:%b %Y}" for s in starts if s not in matched) or "none")

y19 = daily.loc["2019"]
print(f"2019: {int((y19 < 0).sum())} trading days below zero,",
      f"lowest {y19.min():.2f} on {y19.idxmin():%d %b %Y}")
neg = daily.loc["2022":][daily.loc["2022":] < 0]
print(f"2022-24: {len(neg)} trading days below zero, {neg.index[0]:%d %b %Y}",
      f"to {neg.index[-1]:%d %b %Y}, lowest {neg.min():.2f} on {neg.idxmin():%d %b %Y}")
print(f"Latest: {daily.iloc[-1]:+.2f} on {daily.index[-1]:%d %b %Y}")

bills = fred("T10Y3M").loc[:"2026-11-06"].resample("MS").mean()
print("10-year minus 3-month, runs of three months or more:",
      ", ".join(f"{a:%b %Y} ({n})" for a, b, n in runs(bills < 0)))

u = fred("UNRATE").loc["2022":]
print(f"Unemployment: {u['2022-07-01']:.1f}% in Jul 2022, low {u.min():.1f}%",
      f"({u.idxmin():%b %Y}), high {u.max():.1f}% ({u.idxmax():%b %Y}),",
      f"latest {u.iloc[-1]:.1f}% ({u.index[-1]:%b %Y})")

# Why 2022 was different: a probit model, the term premium and debt service
Phi = np.vectorize(lambda z: 0.5 * (1 + erf(z / 2 ** 0.5)))


def probit(x, y):
    """Maximum-likelihood probit of y (0 or 1) on x, by Fisher scoring."""
    X = np.column_stack([np.ones(len(x)), x])
    y = np.asarray(y, float)
    b = np.zeros(2)
    for _ in range(100):
        z = X @ b
        p = np.clip(Phi(z), 1e-12, 1 - 1e-12)
        f = np.exp(-z * z / 2) / np.sqrt(2 * np.pi)
        g = X.T @ (f * (y - p) / (p * (1 - p)))
        H = (X * (f * f / (p * (1 - p)))[:, None]).T @ X
        step = np.linalg.solve(H, g)
        b += step
        if np.abs(step).sum() < 1e-10:
            break
    return b


usrec = fred("USREC")
m3 = (fred("GS10") - fred("TB3MS")).dropna()   # monthly 10-year minus 3-month
fit = pd.DataFrame({"s": m3, "y": usrec.shift(-12)}).loc["1960":"2018"].dropna()
a, b = probit(fit.s, fit.y)
prob = pd.Series(Phi(a + b * m3), index=m3.index)
print(f"Probit, 1960-2018 ({len(fit)} months): P(recession in 12 months) ="
      f" Phi({a:.2f} {b:+.2f} x spread); spread 0: {Phi(a):.0%}, spread -1: {Phi(a - b):.0%}")
begins = usrec.index[(usrec == 1) & (usrec.shift() == 0)]
print("Highest probability in the 24 months before each recession:",
      ", ".join(f"{s:%b %Y} {prob[s - pd.DateOffset(months=24):s - pd.DateOffset(months=1)].max():.0%}"
                for s in begins[begins >= "1962"]))
late = prob.loc["2022":]
over = late.index[late > 0.5]
span = f", {over[0]:%b %Y} to {over[-1]:%b %Y}" if len(over) else ""
print(f"Since 2022: peak {late.max():.0%} ({late.idxmax():%b %Y}); above 50% in {len(over)}"
      f" months{span}; latest {late.iloc[-1]:.0%} ({late.index[-1]:%b %Y})")

month = lambda s: fred(s).loc[:"2026-11-06"].resample("MS").mean()
y10, y2, tp = month("DGS10"), month("DGS2"), month("THREEFYTP10")   # Kim-Wright
print("Deepest month  10y-2y  term premium  expected path (10y - premium - 2y)")
for first, last, n in runs(spread.loc["1990":] < 0):
    worst = spread[first:last].idxmin()
    print(f"{worst:%b %Y}      {spread[worst]:+.2f}         {tp[worst]:+.2f}"
          f"          {y10[worst] - tp[worst] - y2[worst]:+.2f}")

ff, dsr = fred("FEDFUNDS"), fred("TDSP")       # debt service, % of disposable income
q = lambda d: f"Q{(d.month - 1) // 3 + 1} {d.year}"
top = dsr.loc["2022":]
print(f"Fed funds {ff['2022-02-01']:.2f}% (Feb 2022) to {ff.loc['2022':].max():.2f}%"
      f" ({ff.loc['2022':].idxmax():%b %Y})")
print(f"Household debt service: {dsr['2007-10-01']:.1f}% (Q4 2007), {dsr['2019-10-01']:.1f}% (Q4 2019),"
      f" low {dsr.loc['2020':'2021'].min():.1f}% ({q(dsr.loc['2020':'2021'].idxmin())}),"
      f" highest since 2022 {top.max():.1f}% ({q(top.idxmax())}), latest {dsr.iloc[-1]:.1f}% ({q(dsr.index[-1])})")
Run in November 2026 it prints:
Signal    months  deepest  recession  lead  last inverted
Sep 1978      20    -2.14  Feb 1980     17  Jan 1980
Sep 1980      14    -1.36  Aug 1981     11  Jul 1981
Jan 1989       6    -0.32  Aug 1990     19  Mar 1990
Feb 2000      11    -0.41  Apr 2001     14  Dec 2000
Jun 2006      10    -0.15  Jan 2008     19  May 2007
Jul 2022      26    -0.93  none by Oct 2026, 51 months on
Recessions with no signal first: Mar 2020
2019: 3 trading days below zero, lowest -0.04 on 27 Aug 2019
2022-24: 541 trading days below zero, 01 Apr 2022 to 05 Sep 2024, lowest -1.08 on 03 Jul 2023
Latest: +0.35 on 06 Nov 2026
10-year minus 3-month, runs of three months or more: Jun 1989 (3), Jul 2000 (7), Aug 2006 (10), May 2019 (5), Nov 2022 (25), Jun 2025 (3)
Unemployment: 3.5% in Jul 2022, low 3.4% (Apr 2023), high 4.5% (Nov 2025), latest 4.1% (Oct 2026)
Probit, 1960-2018 (708 months): P(recession in 12 months) = Phi(-0.45 -0.73 x spread); spread 0: 32%, spread -1: 61%
Highest probability in the 24 months before each recession: Jan 1970 40%, Dec 1973 68%, Feb 1980 78%, Aug 1981 93%, Aug 1990 29%, Apr 2001 47%, Jan 2008 43%, Mar 2020 41%
Since 2022: peak 76% (May 2023); above 50% in 21 months, Dec 2022 to Sep 2024; latest 11% (Oct 2026)
Deepest month  10y-2y  term premium  expected path (10y - premium - 2y)
Apr 2000      -0.41         +1.26          -1.67
Nov 2006      -0.15         +0.54          -0.69
Jul 2023      -0.93         +0.11          -1.04
Fed funds 0.08% (Feb 2022) to 5.33% (Aug 2023)
Household debt service: 15.8% (Q4 2007), 11.7% (Q4 2019), low 9.1% (Q1 2021), highest since 2022 11.3% (Q4 2025), latest 11.1% (Q2 2026)
Related articles
- Non-farm payrolls: the most watched number in markets, and what it actually leads
- Ethylene cracker utilisation: the leading indicator nobody outside oil has heard of
- The pandemic ended a decade of deflation, and it was the channel, not the amount
- Consumer confidence as a leading indicator: what 48 years of data show