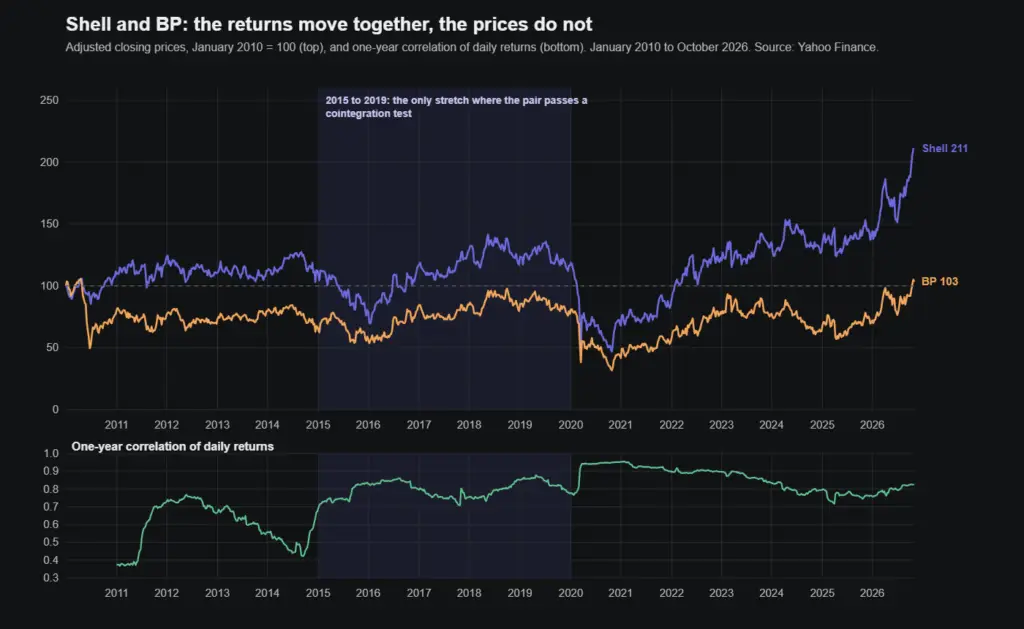
Pairs trading in practice: Shell against BP, 2010 to 2026
A worked pairs trade on Shell and BP: why a correlation of 0.8 is not enough, what a cointegration test shows, and what a simple rule made after costs.

The US 3-2-1 crack spread was $14.60 a barrel in mid-September 2024. By late August 2026 it had reached $75.30, a five-year weekly high on futures prices.
The piece to read first is how refinery margins work, which takes that spread apart barrel by barrel. Ethylene cracker utilisation comes at oil from the petrochemical end, as an early read on the direction of the world economy. Shell against BP is mainly a trading piece, but it also covers sixteen years of two oil majors’ shares.
Other subjects: Macro and markets · Engineering and physics in markets · Açaí from the Amazon to the bowl
A worked pairs trade on Shell and BP: why a correlation of 0.8 is not enough, what a cointegration test shows, and what a simple rule made after costs.
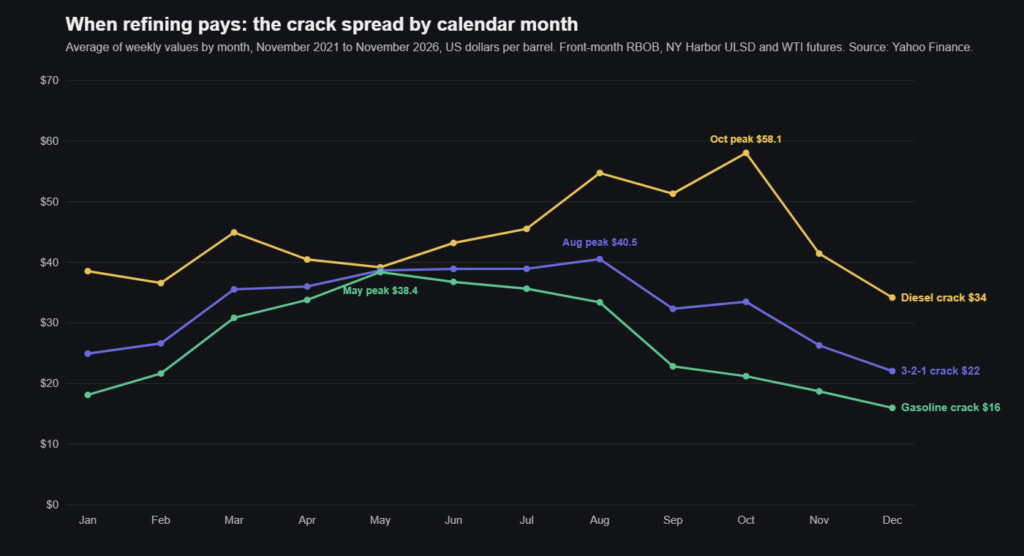
The 3-2-1 crack spread explained with real futures prices: the formula, a worked example, what it leaves out, its seasonal pattern and how it is hedged.
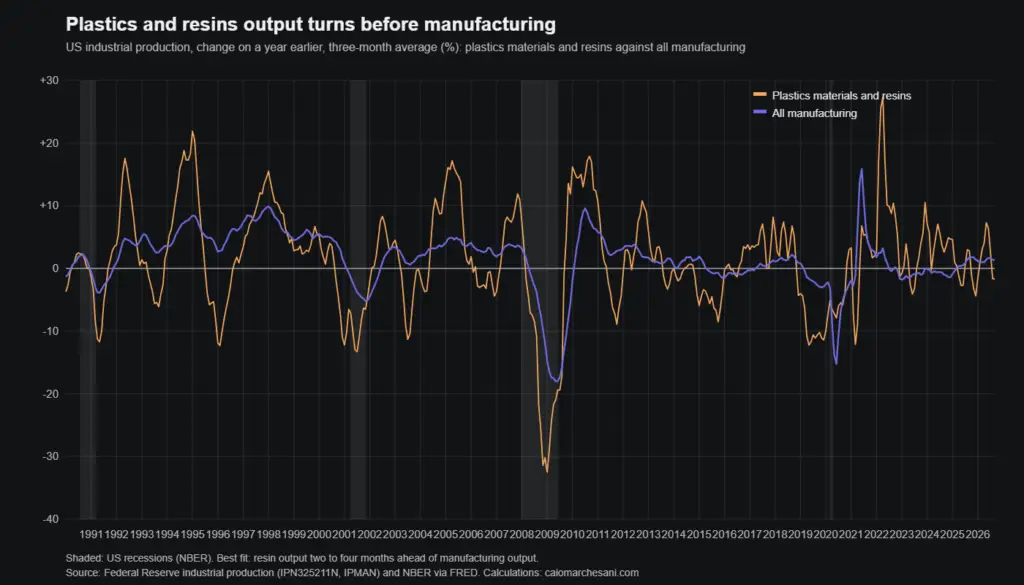
Ethylene cracker run rates as a leading indicator, tested on 50 years of US resin output: what it caught, what it missed, and where it stands now.