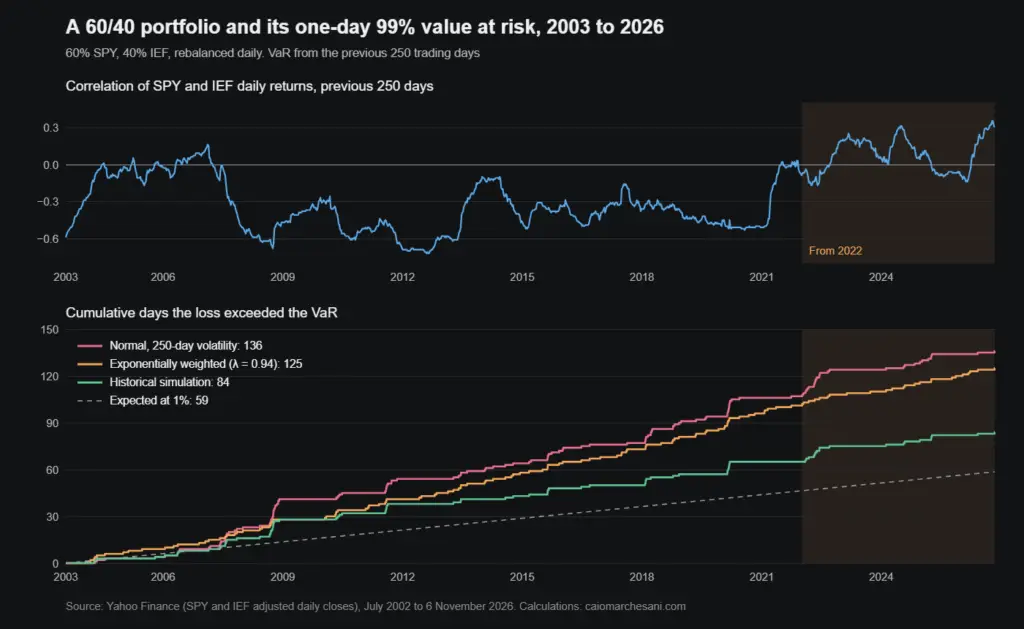
The 60/40 portfolio’s value at risk, tested on 23 years of data
A textbook 99% VaR for a 60/40 portfolio was broken on 17 days in 2022. Three models tested on SPY and IEF since 2003, and what failed: mostly volatility.

From July 2022 the two-year US Treasury yield stayed above the ten-year for 26 months. In the fifty years before, an inversion that lasted more than a few weeks had always been followed by recession within two years. This time none has been declared.
Most of my macro writing tests one indicator at a time and asks what it has really called, and how far ahead. The yield curve is the best known. Consumer confidence is checked against 48 years of data, durable goods orders are read through the core capex line rather than the headline, and non-farm payrolls are judged on what they lead. The series began with ethylene cracker utilisation, a petrochemical number that for several years was the first one I checked.
The rest is about money and prices. Gold against real yields follows a model that tracked gold closely for sixteen years before breaking down in 2022. The pandemic and deflation argues that the channel mattered more than the amount. Three pieces from late 2024 and early 2025 look at the Federal Reserve and Bitcoin: the January FOMC hold, the December meeting and why the Fed matters more than the White House for the price.
A portfolio and a fund get a piece each. The 60/40 test runs a standard risk model on 60% S&P 500 and 40% seven-to-ten-year Treasuries from 2003 onwards, and how a systematic macro fund works follows a simple trend rule on Brent.
Other subjects: Energy and refining · Engineering and physics in markets · Açaí from the Amazon to the bowl
A textbook 99% VaR for a 60/40 portfolio was broken on 17 days in 2022. Three models tested on SPY and IEF since 2003, and what failed: mostly volatility.
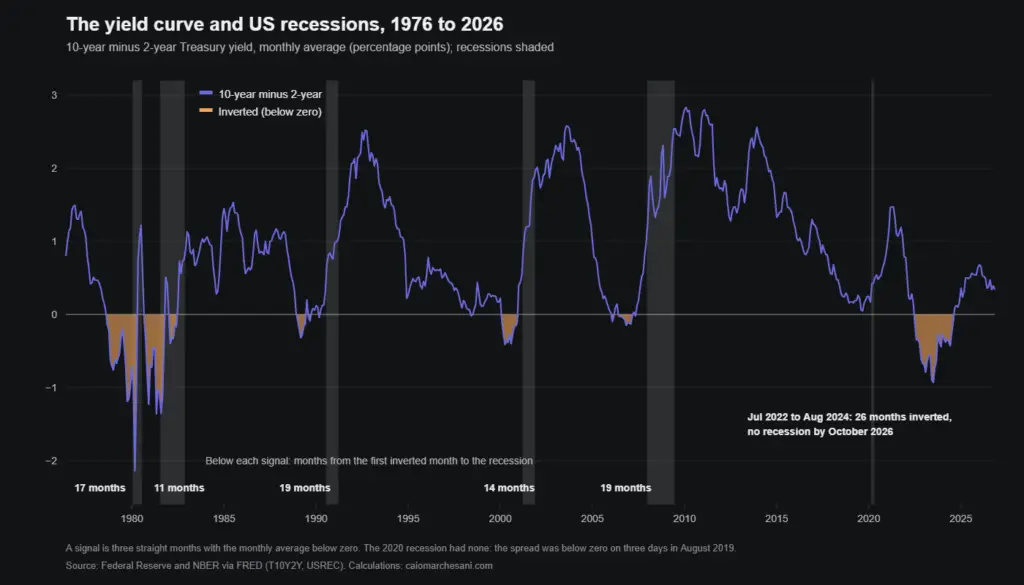
Five yield curve inversions were followed by five US recessions. The sixth, in 2022, was not. Fifty years of the data, and how I use the signal now.
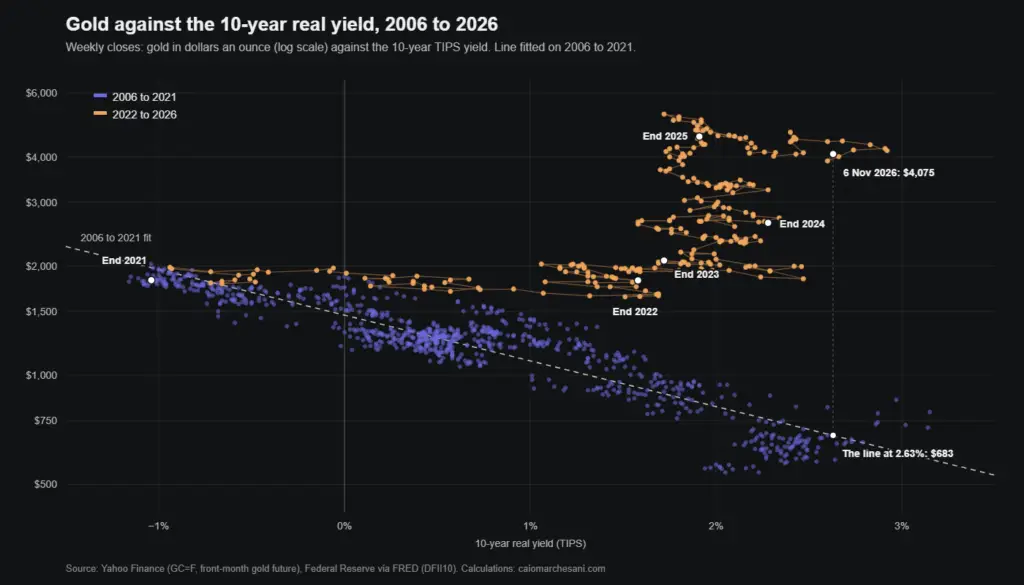
The real yield explained 85% of the gold price for sixteen years. Since 2022 the same model has been out by a factor of six. What broke, and what is left.
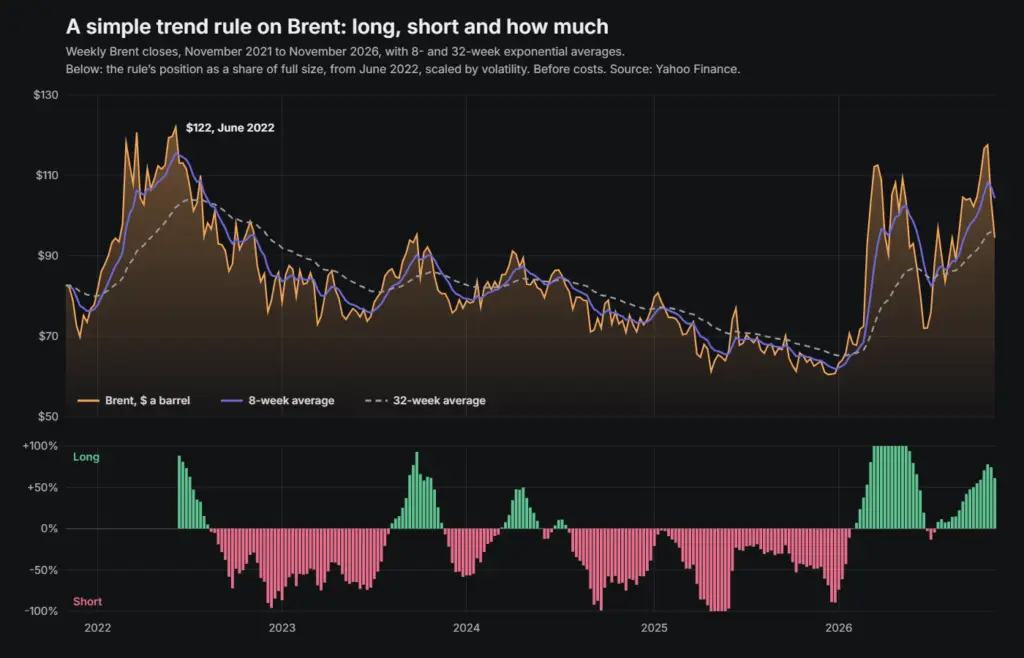
How a systematic macro fund turns prices into trades, step by step, with a worked trend-following example on five years of Brent crude.
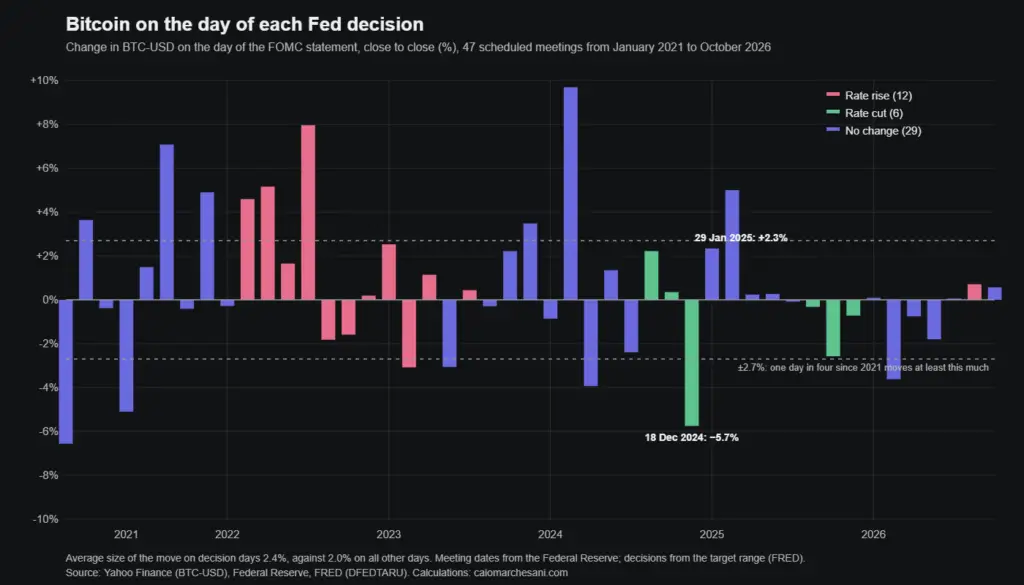
The January 2025 Fed hold and crypto, with 47 Fed decision days since 2021: how big Bitcoin’s moves are, which way they go and how often they reverse.
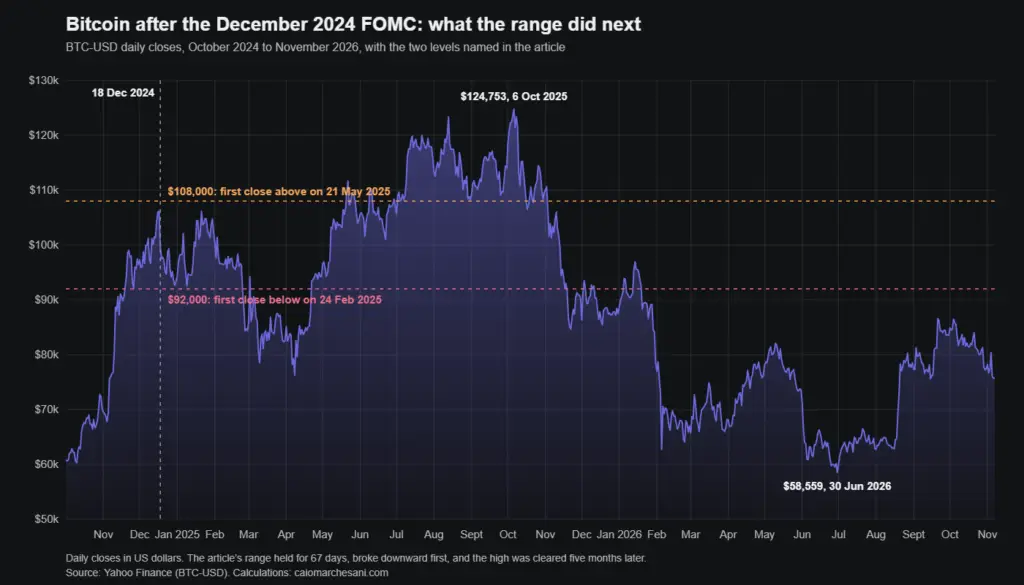
A December 2024 call that Bitcoin had made an interim top, scored against two years of prices: the range, the break, the May 2025 breakout, the 2026 fall.
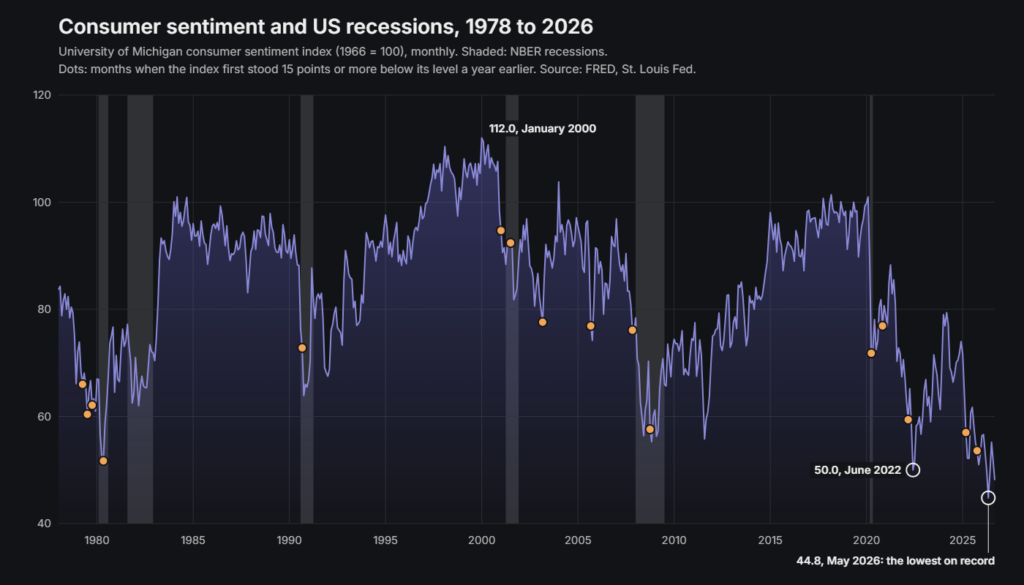
Michigan consumer sentiment hit a record low of 44.8 in May 2026. What the surveys measure, how often a sharp fall has preceded a US recession since 1978, and why spending held up.
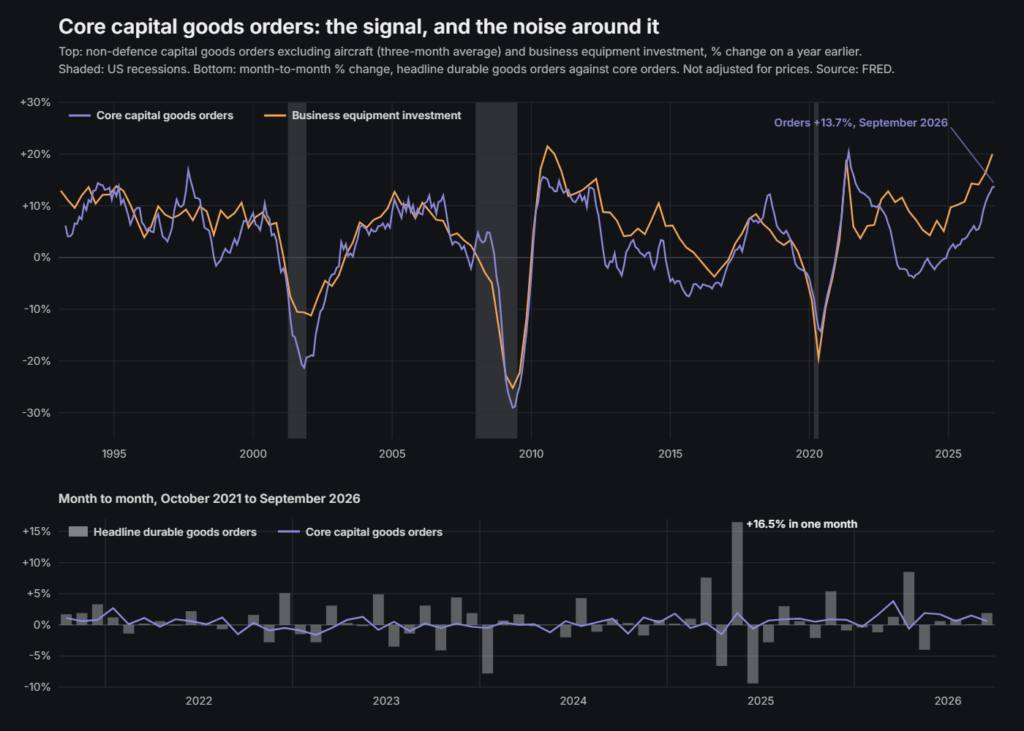
US core capital goods orders hit a record in September 2026. How the durable goods report works, how noisy the headline is, and what thirty years of data say about the lead.
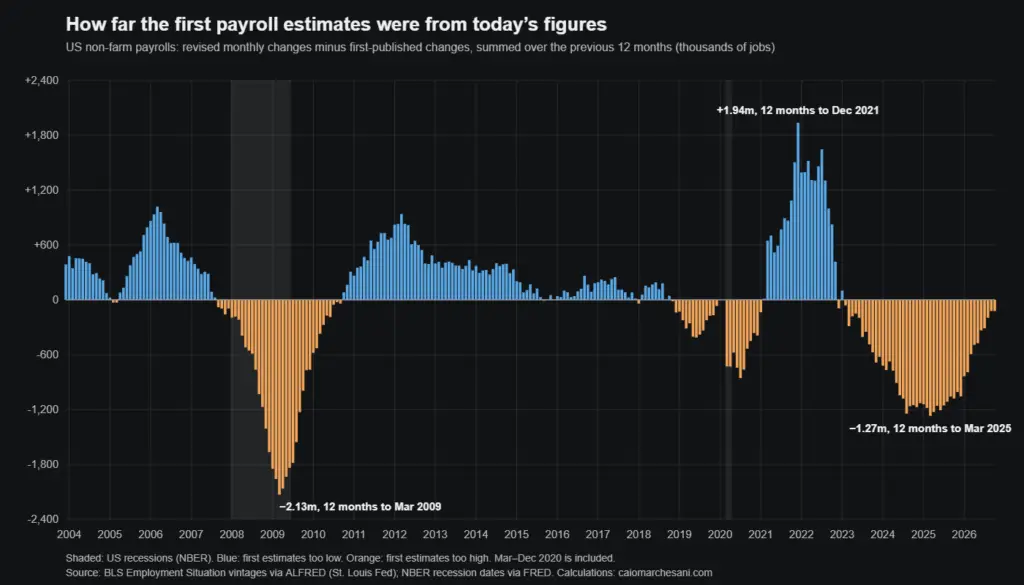
Since 2003 the first payroll estimate has missed today’s figure by 69,000 jobs a month on average. Where the report lags, what it leads, how markets react.
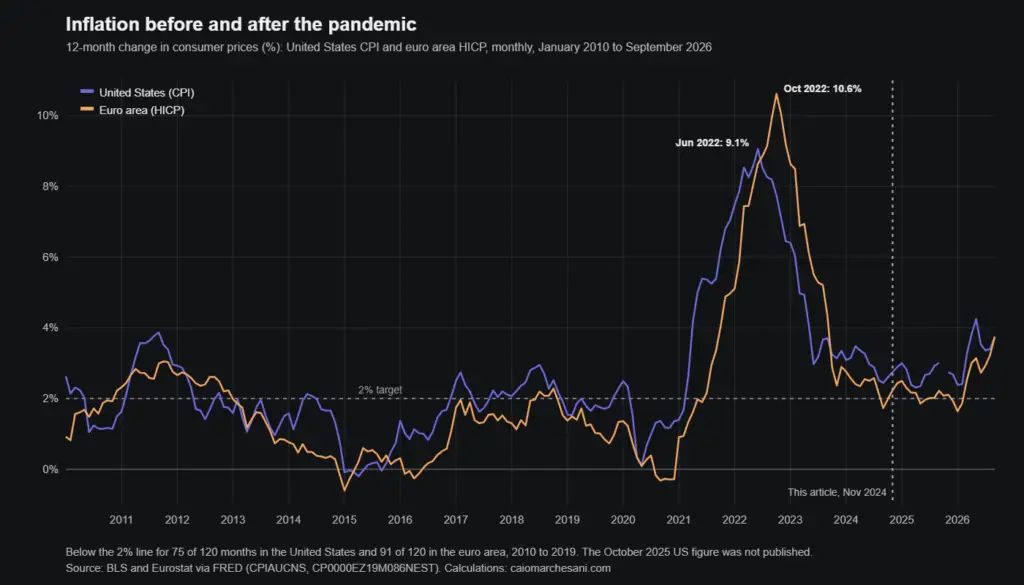
Why ten years of zero rates and QE could not lift inflation to 2%, why sending money to households did, and what the numbers say two years on.